

Peak Detection in Spectral Analysis
In our previous article, “Spectral Data Analysis in Materials Science : Core Approaches towards Integration with Materials Informatics”, we have highlighted the importance and limitations of peak detection-based approach in spectral analysis. By identifying the relationship between each peak and material properties, this approach has high interpretability and is ideal for research, design, and experiments that require deeper understanding. However, it relies heavily on the accuracy of the peak detection result.
We focus on two approaches to perform peak detection in spectra analysis, including threshold-based approach and deep-learning-based approach. Threshold-based approach is more traditionally used. However, it requires appropriate parameters for each spectrum to achieve optimal peak detection results, making parameter setting a difficult yet essential process. On the other hand, deep-learning-based approach is gaining popularity in recent years as an alternative suited for automation tasks without sacrificing accuracy. This approach performs peak detection by learning patterns directly from spectral data, reducing the need for manual parameter tuning at inference, overcoming the limitation of the threshold-based approach. Furthermore, deep learning models also have the potential to adapt to complex signal shapes, requiring minimal further processing such as peak deconvolution.
In this article, we organize peak detection methods by their underlying algorithms as well as how peaks are represented and identified from spectral data. From this perspective, the approaches discussed here can be viewed as intensity-based, segmentation-based, and local shape-based methods, each reflecting a different way of interpreting spectral signals. Among these categories, recent developments have been particularly active in segmentation-based and local shape-based approaches, where deep learning models can be naturally applied. In the following sections, we focus on these deep learning-based methods.
Deep learning-based approach
Within these representation strategies, deep learning is primarily applied in two distinct ways: segment-based peak identification and adaptive ROI image classification.
1. Segment-based peak identification
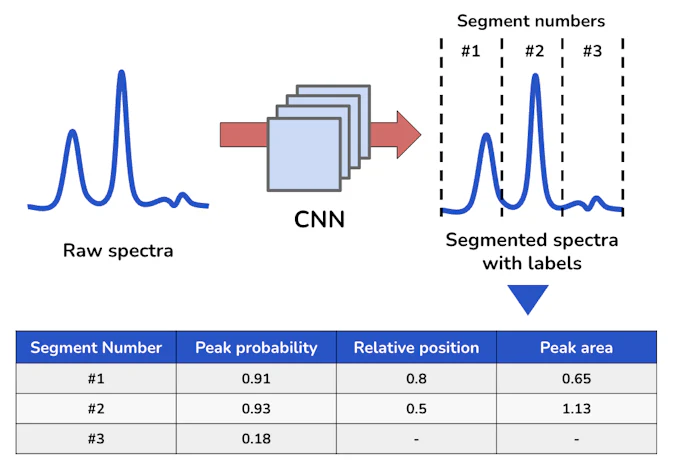
Figure 1. Workflow of segment-based peak identification
Segment-based peak identification is implemented based on a deep learning model applied from object detection task in natural image processing. It is inspired by the “You Only Look Once (YOLO)” technique, which is generally used in finding an object within the whole image and identifying the location (bounding box) and class of that object, to spectral data. Normally, the predicted class is associated with a probability of the object being in that class. Hence, in spectral analysis, we can utilize this to determine the probability of a peak existing in the image. In this case, the labelled classes consist of peak (probability = 1) and non-peak (probability = 0). The model will predict a number between 0 and 1 with higher value representing higher confidence in the detected peak. Typically, the threshold of 0.5 is used to determine if the peak should be considered or not. Along with the probability of peak existence, the model can also predict the relative peak position and associated peak area. Unlike natural image analysis, the input here is a one-dimensional signal indexed along a spectral axis, so a 1D CNN is a natural architectural choice.
In order to apply the concept discussed before, the spectra is partitioned into a number of smaller segments of equal length. The CNN model has the information of the full spectra as input and output the labels for each segment. The labels include the peak existence probability, relative peak location, and peak area. Hence, only one peak can be detected for each segment. Consequently, If the segment width is too large relative to the spacing between neighbouring peaks, multiple nearby peaks may fall within the same segment, which can lead to missed detections. On the other hand, this allows the model to be able to deal with overlapping peaks or unresolved peaks (peaks that are visible as one peak but is a combination of two separated peaks in reality) that spans over more than one segment such as in Figure 2(a). This is a difficult task in other peak detection workflows that requires dedicated effort to perform peak deconvolution. However, if a peak is unusually wide or segmentation is inappropriate, a normal peak can also be mistaken for an unresolved peak, causing false positives as shown in Figure 2(b).
While this approach models the entire spectrum through uniform segmentation, an alternative strategy focuses on analysing local regions around candidate peaks, which leads to the adaptive ROI-based approach described next.
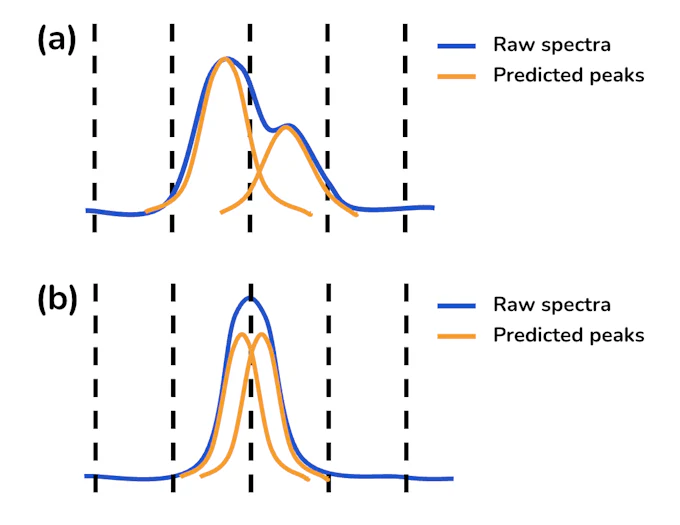
Figure 2. Examples of (a) appropriate segmentation helping with peak deconvolution and (b) inappropriate segmentation causing false positives.
2. Adaptive ROI image classification
Adaptive ROI image classification is an approach implemented by utilizing a deep learning model to classify the Regions Of Interest (ROIs) around the peaks previously detected by another preliminary peak detection method into 3 classes: contain peak(s), does not contain peak, and need further manual investigation. The preliminary peak detection method could be traditional threshold-based peak detection (e.g. XCMS). As mentioned before, the threshold-based approach requires appropriate parameter settings to achieve the highest accuracy. However, in this case, it is possible to use non-optimal parameters while prioritizing to reduce false negatives even if we have to allow more false positives. This is because the false positives can be filtered out by using the Convolutional Neural Network (CNN) model but no new peaks are being detected in this process to reduce false negatives. After preliminary peak detection, ROIs can be specifically extracted based on their respective peak’s properties such as Full Width at Half Maximum (FWHM) or spectral intensity around the peak. These adaptive ROIs are then rescaled to the same maximum value and treated as image inputs for the deep learning model.
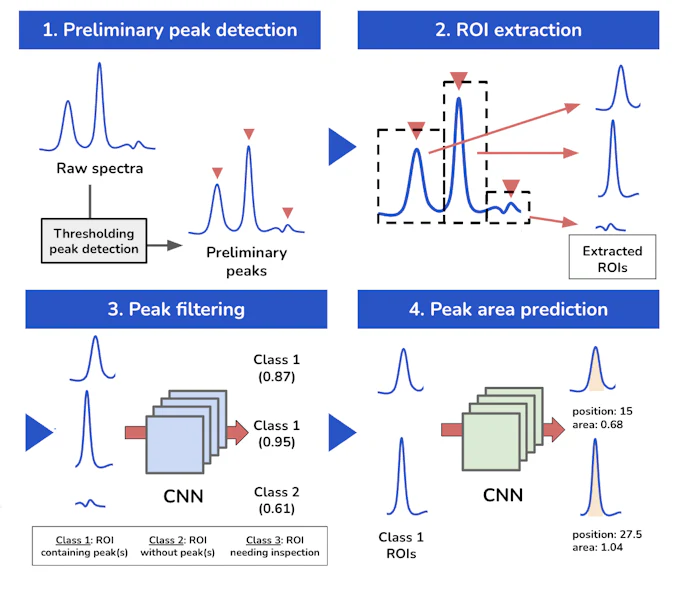
Figure 3. Workflow of ROI image classification
Similar to how recent technology has shown the potential to identify objects in natural images, CNN model can be applied to this peak classification task. Each ROI image is inputted into the 2D CNN model to classify into classes. The model generally gives the probabilities of the peak being in each class (combined to 1), and the class with highest probability is used for the final peak filtering result. It is important to note that the model is learning from the shapes and patterns of ROI images. Consequently, it does not learn anything related to the peak intensity outside each ROI. This makes the approach robust to variations in measurement conditions and intensity scaling, and adaptable across different types of spectra, but limits its ability to account for relative peak importance or global spectral structure.
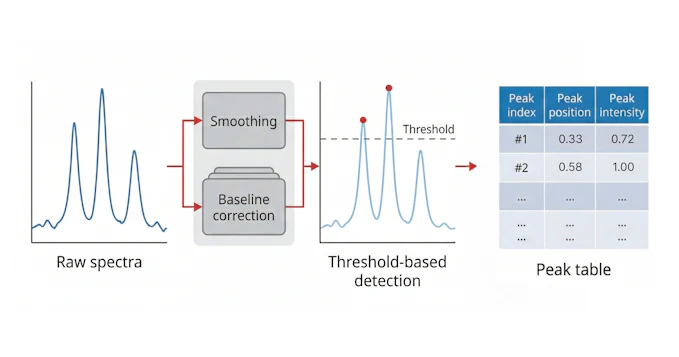
Figure 4. Conventional threshold-based peak detection
After each ROI is assigned to a class, the ones classified as “contain at least one or more peaks” are further processed using another CNN model. This second model is often a structure similar to U-net which is popular for image segmentation tasks. It is used to determine the peak region(s) within that ROI. This will help in determining the peak position as well as the peak area. However, the labels for both CNN models must be done manually for each ROI during the model training process.
Which one is better?
Having examined these approaches individually, we now compare them to clarify where each method performs best.
Method | Advantages | Disadvantages |
|---|---|---|
Threshold-based approach | Flexible. | Requires appropriate parameter tuning to achieve optimal result. |
Segment-based peak identification | Can perform end-to-end peak detection with shorter computation time Can detect overlapping and unresolved peaks. | Cannot perform well in spectra with a large number of peaks because only one peak can be detected per one segment. Might result in false positives from mistaking a wide peak as unresolved peaks. |
Adaptive ROI image classification | Can add on top of existing preliminary peak detection methods. Is suited for spectra with a large number of peaks | Uses longer workflow and computation time |
Each method has its own advantages and limitations, as summarised in the table above. Therefore, it is crucial to understand which technique is suitable for your experiment conditions. Segment-based peak identification can perform well in more complex spectra with more overlapping peaks or potentially hidden unresolved peaks. However, we must be careful of false positives when using this model because the segmentation is fixed based on the number of segments rather than each peak. Consequently, there is a chance that a partition is done close to the peak as in Figure 2(b) and leads to inaccurate results. On the other hand, Adaptive ROI image classification makes the decision by looking at specially extracted adaptive ROI fit for each peak and thus does not suffer from the same problem. Furthermore, it can also perform better with spectra with a large number of peaks since segment-based peak identification can only detect up to the designated number of segments. Moreover, Adaptive ROI image classification can also be applied to various types of spectra (e.g. LCMS, XRD) with different characteristics more easily since it is evaluating the local shape of only ROI image, in contrast to the segment-based peak identification which evaluates the entire spectra. However, the image classification approach also needs more effort to implement. It uses more steps to perform peak detection and could lead to more than twice the calculation time of the segment-based approach. In addition, the image classification approach also needs manual labelling for training data while it is possible to use spectra simulation as an alternative in case of segment-based peak identification.
The methods discussed here all address the same task of peak detection, yet they differ fundamentally in how a peak is defined. The threshold-based approach identifies peaks based on intensity, the segment-based approach treats peaks through uniform partitioning of the entire spectrum with probabilistic estimation, and the adaptive ROI approach focuses on local shape around candidate regions. These differences reflect distinct ways of representing and extracting information from spectral data. Therefore, the choice of method should be framed as a decision about which representation is most appropriate for the characteristics of the spectra and the type of information one aims to extract reliably.
References
- Jirayupat , C. (2024, November 28). Spectral Data Analysis in materials science : Core approaches towards integration with Materials Informatics. miLab. https://milab.mi-6.co.jp/article/t0003en#hbe345fc161
- Mottershead, K., & Miller, T. H. (2023). Application of deep learning to support peak picking during non-target high resolution mass spectrometry workflows in environmental research. Environmental Science: Advances, 2(6), 877–885. https://doi.org/10.1039/d3va00005b
- Melnikov, A. D., Tsentalovich, Y. P., & Yanshole, V. V. (2019). Deep learning for the precise peak detection in high-resolution LC–MS data. Analytical Chemistry, 92(1), 588–592. https://doi.org/10.1021/acs.analchem.9b04811
- Kensert, A., Bosten, E., Collaerts, G., Efthymiadis, K., Van Broeck, P., Desmet, G., & Cabooter, D. (2022). Convolutional neural network for automated peak detection in reversed-phase liquid chromatography. Journal of Chromatography A, 1672, 463005. https://doi.org/10.1016/j.chroma.2022.463005
- Smith, C. A., Want, E. J., O’Maille, G., Abagyan, R., & Siuzdak, G. (2006). XCMS: processing mass spectrometry data for metabolite profiling using nonlinear peak alignment, matching, and identification. Analytical Chemistry, 78(3), 779–787. https://doi.org/10.1021/ac051437y
- Redmon, J., Divvala, S., Girshick, R., & Farhadi, A. (2016). You only look once: Unified, real-time object detection. 2016 IEEE Conference on Computer Vision and Pattern Recognition (CVPR), 779–788. https://doi.org/10.1109/cvpr.2016.91
- Ronneberger, O., Fischer, P., & Brox, T. (2015). U-Net: Convolutional Networks for Biomedical Image Segmentation. Lecture Notes in Computer Science, 234–241. https://doi.org/10.1007/978-3-319-24574-4_28